
![]()
Mapping Urban Living Standards in Developing Countries with Energy Consumption Data


Rapid urbanization in low and middle-income countries is contributing to the ‘urbanization of poverty’. Yet the true scale and nature of this challenge are unknown. Census data are infrequent and household surveys generally do not have large enough samples to provide representative data for individual cities, let alone smaller areal units such as neighborhoods. These traditional data sources are, therefore, of limited use when policymakers need timely and spatially explicit data to support efficient resource allocation as part of anti-poverty agendas.
Drawing inspiration from recent work using energy consumption as a proxy for subnational output, we demonstrate how residential electricity consumption data can be used to provide estimates, by area, of urban living standards in Karachi.
Several features of electricity consumption data help identify urban locations that may be disproportionately affected by economic shocks. Almost 97% of urban residents have access to electricity, and electricity companies collect data regularly in almost real-time. There is also a strong correlation between electricity consumption and living standards because the adoption and use of electric appliances in low-income contexts is a strong indicator of improvements in household living standards.
Figure 1 illustrates the relationship using data from Pakistan - the Household Income and Expenditure Survey (2018-19) contains information on electricity consumption while also allowing for the construction of an Electrical Appliance Index (EAI). (Don’t know how to read this chart? No problem. Click here to learn how.)
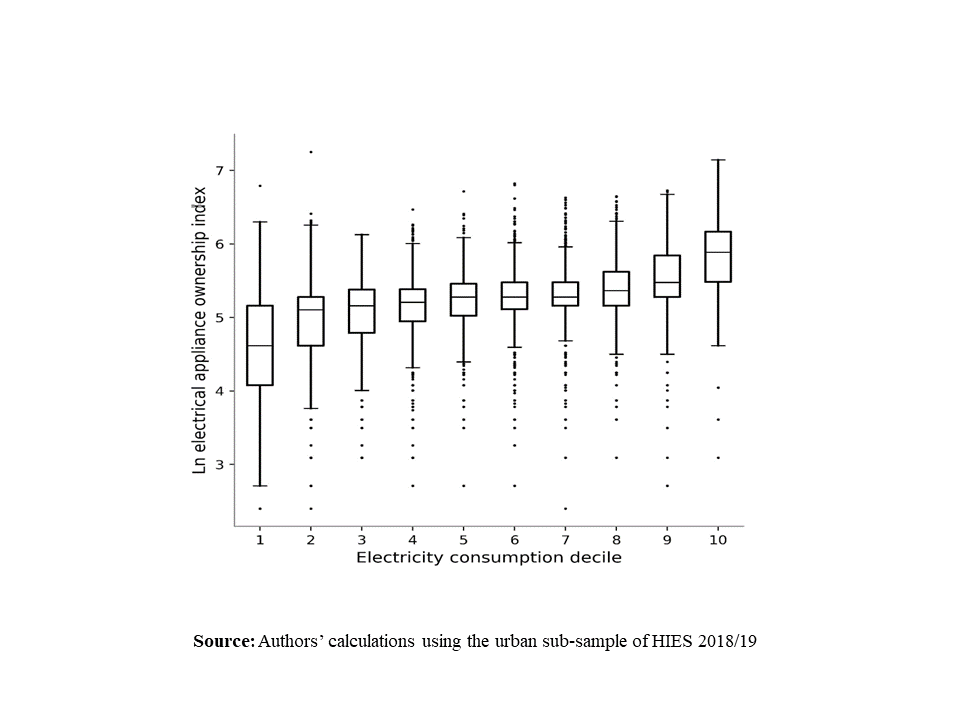
Figure 1: Electricity Consumption and Asset Ownership
As expected, the association is positive (despite concerns about potential measurement error), with median values for the EAI increasing sharply in the lowest and highest deciles.
The Electricity Appliance Index explains 37 percent of the variation in household electricity consumption once family size and dwelling size are taken into consideration. There also appears to be a strong positive association between higher levels of electricity consumption and higher levels of overall expenditure on non-durables (a proxy for living standards) (See Fig. 2).
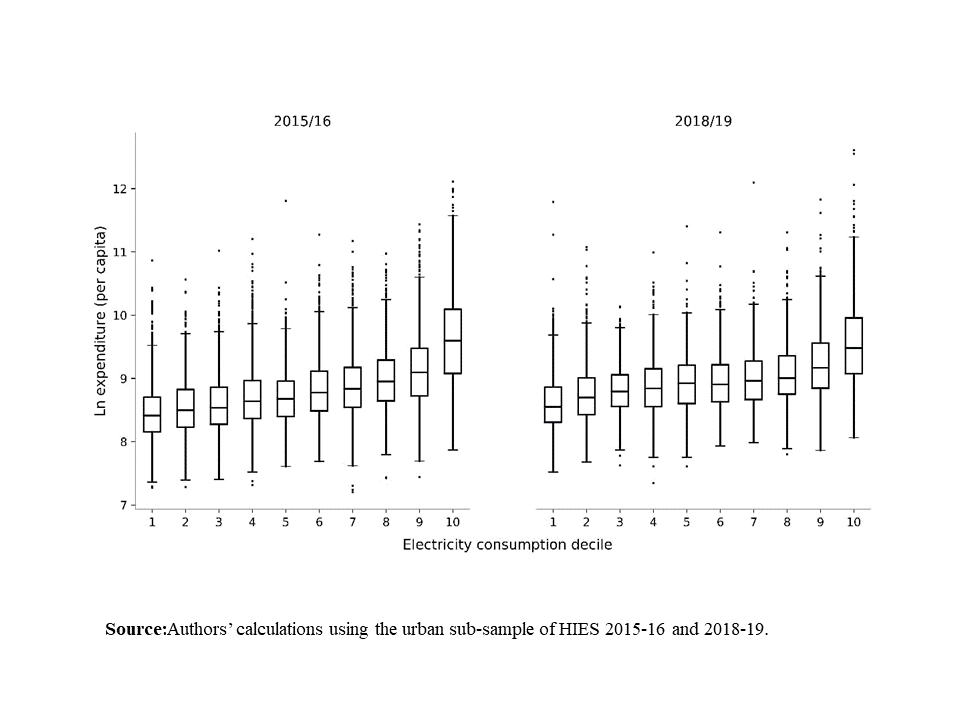
Figure 2: Electricity Consumption and Per Capita Expenditure
In order to map living standards in Karachi, we created spatial units that approximate blocks and neighbourhoods that conform to readily observable natural boundaries. This ‘organic’ geometry has a more substantive, analytic, and practical value for planners and policymakers than either enumeration areas or standard grids superimposed on the urban landscape. To ensure the anonymity of individual households, given the potentially sensitive and disclosive nature of the data, blocks were spatially aggregated such that each final block contains a minimum of five residential meter observations. The final map contains 45,081 blocks with five or more observations.
Each block is classified into an energy consumption decile using two different sources of data. First, we use data on residential electricity consumption provided by K-Electric (KE), the monopoly provider of electricity in Karachi. The data consist of the average kilowatt-hours (kw/h) of electricity consumed per month per meter between 1 April 2019 to 31 March 2020 (the year before Covid-19). The raw data included 2.5 million residential meters in Karachi and surrounding rural areas. A single unit of consumption translates into roughly 30 hours of use of a standard lightbulb in a month, which we take as a reasonable lower threshold. The final sample consists of 2,048,418 observations. We have a high degree of confidence that these data cover most households in Karachi.
We calculated the mean, median, and standard deviation of average monthly electricity consumption for all meters in each block. Consumption decile thresholds were calculated from the cleaned KE meter data and each block was classified into a decile based on the median meter value within that block. Results are reported in deciles as we are primarily interested in relative living standards with clear thresholds—standard practice in living standards measurement for policy applications. This approach also strengthens privacy protections by expanding the range of potential values that could theoretically be attributed to any individual household within a block. More precise point estimates could be used for specific research or policy applications (e.g. to monitor marginal changes in local welfare due to an economic shock). However, given the potentially disclosive nature of this type of data, great care is required in the reporting of such analysis to ensure maximum privacy.
There are a few other sources that provide the scale and spatial granularity of residential electricity consumption data, making it an attractive source for generating rough areal estimates of relative living standards in urban areas. One potential, and readily available, alternative is night lights data. To determine if such data could be similarly used as a proxy for energy consumption at block or neighbourhood scale, we processed data from the Visible Infrared Radiometer Suite (VIIRS) from NASA.
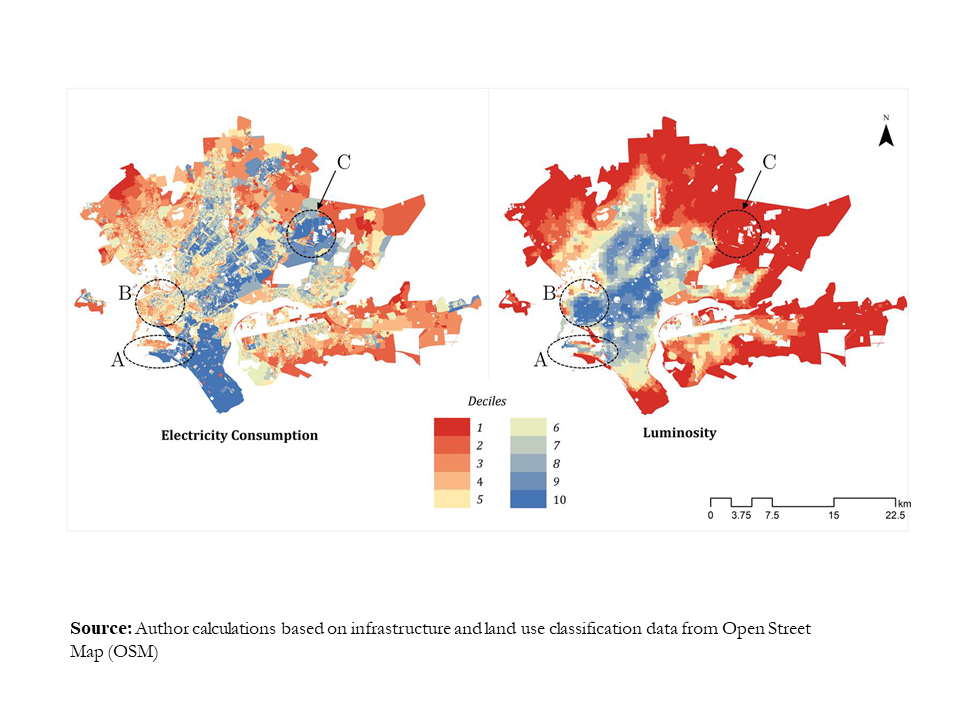
Figure 3: Electricity Consumption-Based Areal Estimates of Relative Living Standards in Karachi
Figure 3 above compares the spatial distribution of median electricity consumption and luminosity for every block in Karachi. Area A shows a peninsula in Karachi South that contains diverse neighbourhoods. The south-eastern section contains a neighbourhood known as Clifton—one of the wealthiest in the city. On the northwest side are a collection of much poorer settlements adjacent to major port facilities. The block-level estimates from the KE data reflect these socioeconomic geographies while the luminosity data would misclassify Clifton as one of the poorest areas of the city and some of the poorer neighbourhoods as relatively wealthy.
Area B encompasses the old city centre close to the commercial port, including areas such as Lyari, which is one of the most densely populated neighbourhoods in the city and contains a mix of poor, middle, and upper-middle-income residents. Again, the KE data reflect this diversity while the luminosity data would rank this as one of the wealthier parts of the city. Finally, area C on the map contains Malir Cantonment—an area that contains both a military base and a civilian residential area that has some of the most expensive property prices in the city. Electricity consumption reflects this affluence while luminosity does not.
The likely explanation for these discrepancies relates to the nature of the information that luminosity data provide. While often used as a proxy for GDP or ‘economic activity’ in general, luminosity data are also used to model population distributions. While reliable population statistics are not available at high spatial resolution in Karachi, we find that residential meter count per block (a proxy for population density) is more strongly correlated with luminosity (r2=.234) than median consumption values.
This, alongside the fact that luminosity is also correlated with economic infrastructure such as street lamps industrial facilities, explains the discrepancies observed in our three case study areas. The wealthy neighborhood of Clifton is less densely populated than those directly adjacent to the port; the neighborhoods captured in area B are some of the most densely populated in the city, and Malir Cantonment (circle C) is effectively a wealthy suburb.
The VIIRS data may still prove to be a useful proxy for economic activity more broadly in cities, and as an input into population distribution models, but it does not provide spatially accurate estimates of household living standards on its own. However, future research could explore combining luminosity data with other ancillary sources to model living standards within cities.
Felix Agyemang, Research Associate, University of Bristol
Sean Fox, Lecturer, University of Bristol
Rashid Memon, Assistant Professor, Department of Economics, LUMS

Mahbub ul Haq Research Centre at LUMS


Postal Address
LUMS
Sector U, DHA
Lahore Cantt, 54792, Pakistan
Office Hours
Mon. to Fri., 8:30 a.m. to 5:00 p.m.