
![]()
Drivers of Crop Agricultural Productivity Growth in Pakistan


Introduction
Growth in total factor productivity (TFP) is usually measured as growth in aggregate output minus growth in aggregate input. Previous studies have estimated TFP growth in agriculture sector of Pakistan, but at least three features of these studies are noteworthy. (No idea what we’re talking about? Here’s an easy explanation!)
First, with few exceptions, these studies have merged data of crop with livestock sectors, making it difficult to draw conclusions about TFP trends in crop agriculture alone. Second, due to paucity of , majority of the studies have estimated TFP at national level, ignoring TFP change across districts. Finally, most of the studies have used a framework due to which TFP cannot be exhaustively decomposed into measures of technical change and efficiency change.
In a background paper to the World Bank’s 2022 country memorandum for Pakistan, we have used district-level panel data[1] to show that between 1993 and 2019, TFP in Pakistan declined mostly due to falling rates of technical change (inward shift in production frontier), technical efficiency change (productivity shortfall from the frontier) and scale-mix efficiency change (productivity shortfall associated with diseconomies of both scale and scope).[2] Highly diverse regional performance indicates that Punjab and Sindh provinces experienced increase in TFP, but KPK and Balochistan provinces witnessed large TFP declines. In most provinces, primary drivers of crop agriculture TFP change are technical change, technical efficiency change and scale-mix efficiency change.
Evidence on TFP and Efficiency Change
The estimates in Table 1, Panel A show that between 1993 and 2019, mean TFP in Pakistan decreased by 26% (0.7403 – 1 = –0.260) due to the combined effects of a 17.1% drop in technical change, 8.3% fall in technical efficiency, and 2.6% decrease in scale-mix efficiency (dTFP=0.829 x 0.917 x 0.974 = 0.740). Panel B displays arithmetic averages and shows that TFP in Pakistan declined at an average annual rate of –1.15% over the sample period, which is attributed to technical regress (slow uptake of technology) at –0.72% per annum (p.a.), deterioration in technical efficiency (poor farm management practices) at –0.33% p.a. and decrease in scale-mix efficiency at –0.10% p.a. (d ln TFP= –0.72 – 0.33 –0.10 = –1.15%). However, these results conceal the pattern of TFP growth in the four provinces.
Figure 1 reveals that the crop sector in Punjab produced twice as much output in 2019 as in 1993; the index of the aggregate quantity of output grew at an average rate of 2.68% per year, and the index of the aggregate quantity of inputs grew by 2.24% per year. The measure of TFP grew at a long-run average rate of 0.44% p.a. Table 1 shows that the TFP in Punjab rose by 12% at the back of a 68% increase in technological change (2% p.a.) and a 30.4% fall in scale-mix efficiency (–1.4% p.a.).
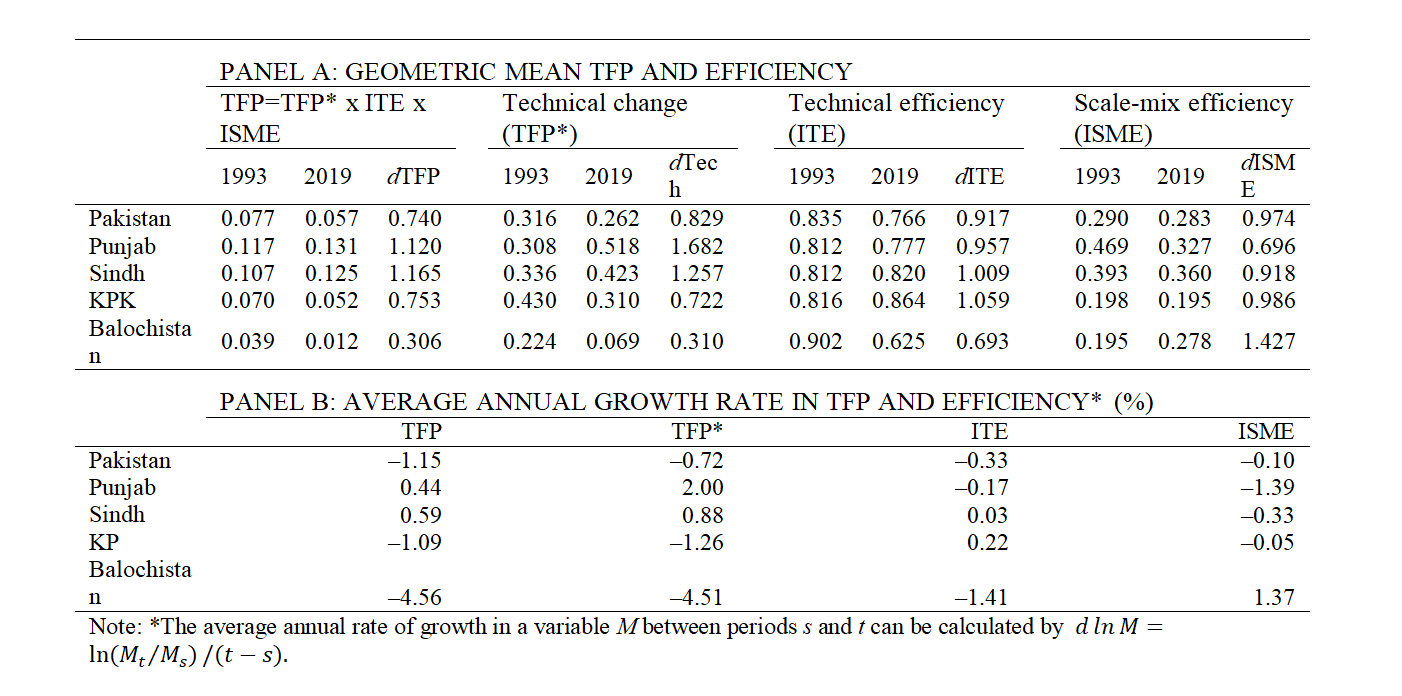
Table 1: TFP and components of efficiency change (1993-2019)
Source: Data was compiled by the authors from various sources
The aggregate quantity of output produced by crop agriculture in Sindh province grew at an average rate of 2.1% per year from 1993 to 2019 (Figure 1). Meanwhile, the index of aggregate quantity of inputs used increased by 1.51% leading to TFP growth at the rate of 0.59% per year. A geometric mean TFP in Sindh province increased by 16.5% (Table 1, Panel A) largely due to the combined effects of a 25.7% growth in technical change (0.88% p.a.) and –8.2% fall in scale-mix efficiency change (–0.33% p.a.).
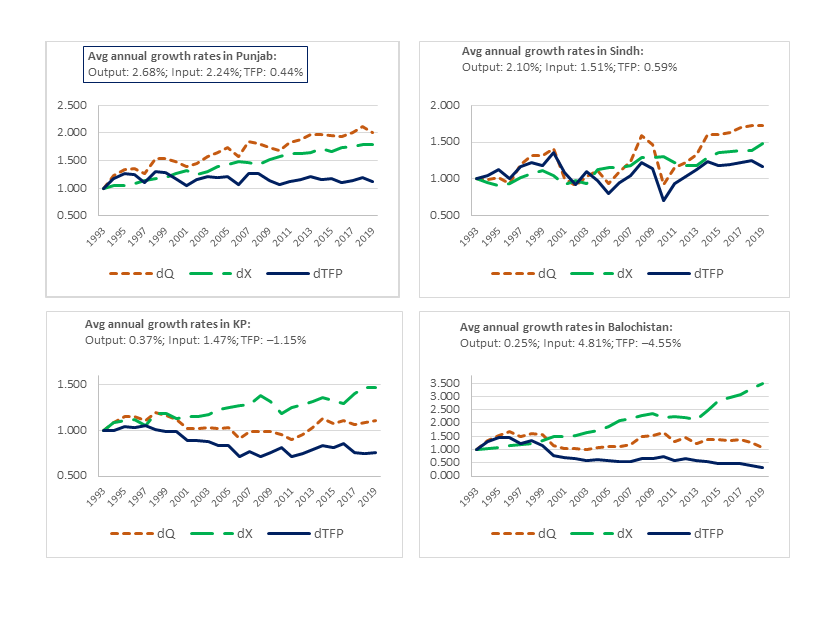
Figure 1. Quantity index of output, input, and TFP in the four provinces, 1993 – 2019
Source: Data was compiled by the authors from various sources
Figure 1 also depicts that in the two smaller provinces, Khyber Pakhtunkhwa (KPK) and Balochistan, a major driver of crop output growth was not productivity growth. Data for KPK shows that the index of aggregate crop output grew at an average rate of 0.37% per year, far less than 1.5% per year growth in aggregate quantity of input, leading to a TFP decline at the average rate of 1.1% per year. KPK experienced a large TFP decline mainly due to technological regress at an average rate of –1.26% p.a. (Table 1, Panel B).
Similarly, in Balochistan, nearly 7% growth in aggregate output was driven by a substantial increase in input growth, which led to a steep decline in TFP (Figure 1). The index of aggregate quantity of output in Balochistan grew at an average annual rate of 0.25% relative to the index of aggregate quantity of inputs that grew at an average annual rate of 1.9% leading to a TFP decline at the average rate of 4.6% per year. As in KPK, Balochistan also experienced a large TFP decline owing to technological regress (–4.51% p.a.) due to an inward shift of the production possibility frontier.
How can productivity be enhanced?
In the Punjab, technological change was a major driver of TFP growth, but improvements in technical and scale-mix efficiencies have played a much smaller role. There is ample room to tap into these components of TFP change. Technical efficiency can be improved by dissemination of new technology and long-term investments in education and training programs in lagging districts. Low expected returns to growers lead to change in the scale and input-mix leading to lower scale-mix efficiency. The finding that large scale-mix inefficiency persists in the province suggests that a move towards a gradual liberalization of the product market will pay dividends.
The finding that the production possibility frontier has not expanded in Sindh and rather contracted in KPK and Balochistan clearly suggests the need for making public and private investments in agricultural R&D focusing on the development of relevant cultivars (here’s a fun way to understand what this means), and new high-yielding cereal and non-cereal seed varieties. R&D can also help improve the quality and provision of high-quality seeds. Introducing effective controls on the marketing of sub-standard seeds in the un-can also contribute to more productive agricultural activity. Yet more measures include development and upgradation of agricultural machinery, and alignment of crop extension services for accelerated distribution of technology to lagging areas. It is important to note at the same time that large variations in production frontiers can also be partly attributed to climate change-related variations in yields.
Finally, analysis of sources of TFP and efficiency reveals that a dominant source of productivity growth is crop specialization. Our results suggest that districts producing a large share of value-added crops have the highest TFP, scale-mix and technical efficiency elasticity, indicating that specialization in the light of comparative advantage can pay the highest dividends. Investment in road density provides greater market access and lowers transport costs, which in turn raises TFP by improving scale-mix efficiency. Moreover, increased capital deepening through agricultural mechanization improves TFP by lifting scale-mix efficiency of districts. Hence, policies that increase private investment to raise the stock and quality of agricultural machinery can become an effective lever to raise TFP all over the crop agriculture sector.
This post is based on Burki, Abid A., S. Ahmad, M. R.M. Khan (2022). Recent Trends and a Decomposition of District-level Crop Agriculture Productivity in Pakistan, Background paper for Chapter 4 of “From Swimming in Sand to High and Sustainable Growth: A Roadmap to Reduce Distortions in the Allocation of Resources and Talent in the Pakistani Economy.” Pakistan’s Country Economic Memorandum, World Bank, Washington, DC. http://hdl.handle.net/10986/38133
[1] We use data of one aggregate output quantity and six aggregate input quantities (e.g., land, labor, fertilizer, tractors, tubewells and thrashers).
[2] We estimate the Färe-Primont TFP index and decompose into technical change, technical efficiency change and scale-mix efficiency change.
Abid A. Burki, Adjunct Professor (Economics) at LUMS and Fellow, MHRC, LUMS
Shabbir Ahmad, Research Fellow, Institute of Social Science Research, University of Queensland
Raza Mustafa Khan, Teaching Fellow (Economics), LUMS

Mahbub ul Haq Research Centre at LUMS


Postal Address
LUMS
Sector U, DHA
Lahore Cantt, 54792, Pakistan
Office Hours
Mon. to Fri., 8:30 a.m. to 5:00 p.m.