Why Do Income and Wealth Inequalities Matter for Pakistan?
Inequality has emerged as a major global challenge around the world, and reducing inequalities within and amongst countries has been recognized as a UN SDG goal (no. 10). Growing levels of inequality tend to create poverty because money continues to move from those who must spend (consumers) to those who likely already have more than what they need (profiting producers). Income and wealth inequalities deserve attention because they can undermine equality of opportunity by giving the rich a head start over other classes (such as through better educational, health and economic opportunity). Increasing inequality also tends to diminish aggregate demand in the economy, increasing the chances of a recession setting in, to which Stiglitz (2010) rightly draws our attention.
Despite the role of inequality in influencing the economy, life chances, and poverty, a government policy focus on, and prioritisation of, poverty alleviation alone is both inadequate for true development, and masks the true extent of income/wealth inequality in Pakistan. We show that growth in income in Pakistan is largely pro-rich and wealth inequality is twice the level of income inequality. The wealthiest 10 percent of households own 60 percent of household wealth, while the least wealthy 60 percent own just one-tenth of it. A simulation analysis reveals that more equitable wealth distribution is far more effective a remedy to poverty than a more equitable income distribution. More details on methodology, data and results are in Burki et al. (2020).
Is income inequality on the rise?
Income is a flow of money received by a household from wages and employment, but due to data constraints we use consumption expenditure on non-durables from household surveys as proxy for income, aggregated at the household level. We use the growth incidence curves approach to measure inequality trends, which reveal that income inequality is rising.
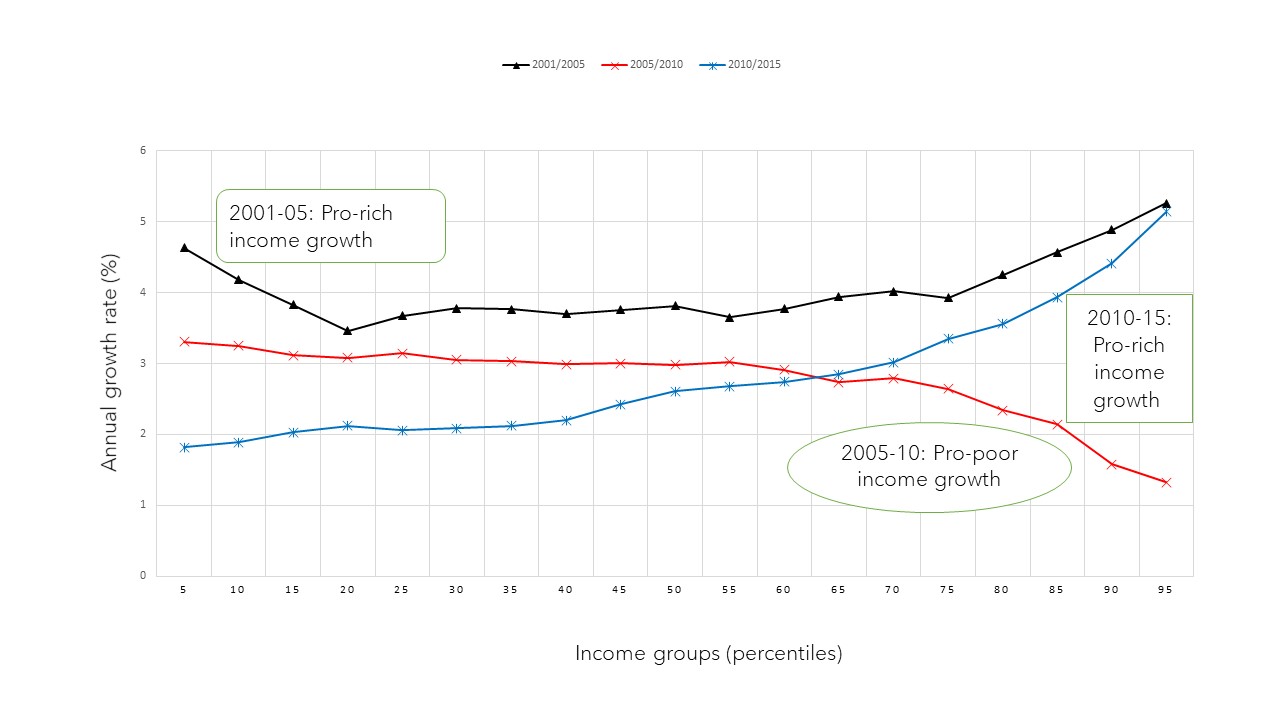
Figure 1 displays three growth incidence curves from 2001-02 to 2015-16 indicating that growth in income has mostly been pro-rich. Simply put, the heights of the three curves indicate that since the beginning of pro-market reforms, trade liberalization and deregulation policies in the late 1990s, per capita income growth of the households below 65th percentile has monotonically decreased compared to all of those in the upper income quintiles. The growth in income of the upper quintiles has been highly favorable throughout, except the Fiscal Years 2005/06 to 2010/11 period, which overlapped with a global downturn due to the 2007/8 recession.
Source: Authors
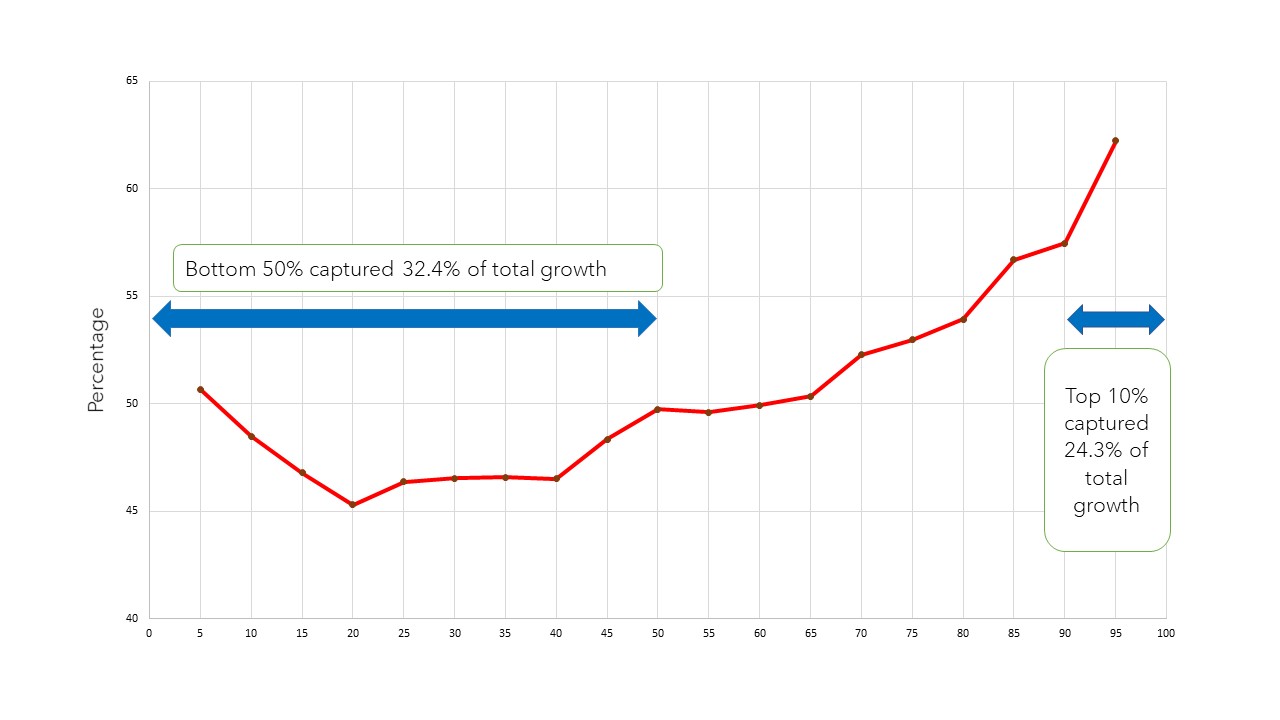
From 2001/02 to 2015/16, the top 10 percent of households captured 24 percent of the total income growth compared to those in the bottom 50 percent who captured 32 percent of the income growth (Figure 2). The rising gap between incomes of the rich and the poor indicates that the fruits of economic growth were not shared with the have-nots.
Source: Authors
Is wealth inequality more than income inequality?
By household wealth, we mean a stock of twenty-three types of valuable possessions, including property wealth, financial wealth, cash and gold wealth, pension and insurance wealth, etc. The Gini coefficient, as a measure of inequality in income and wealth, shows that wealth inequality (70.7%) is more than twice the level of income inequality (32.7%). But the Gini index is not an ideal measure of wealth inequality because a large proportion of households report zero wealth.
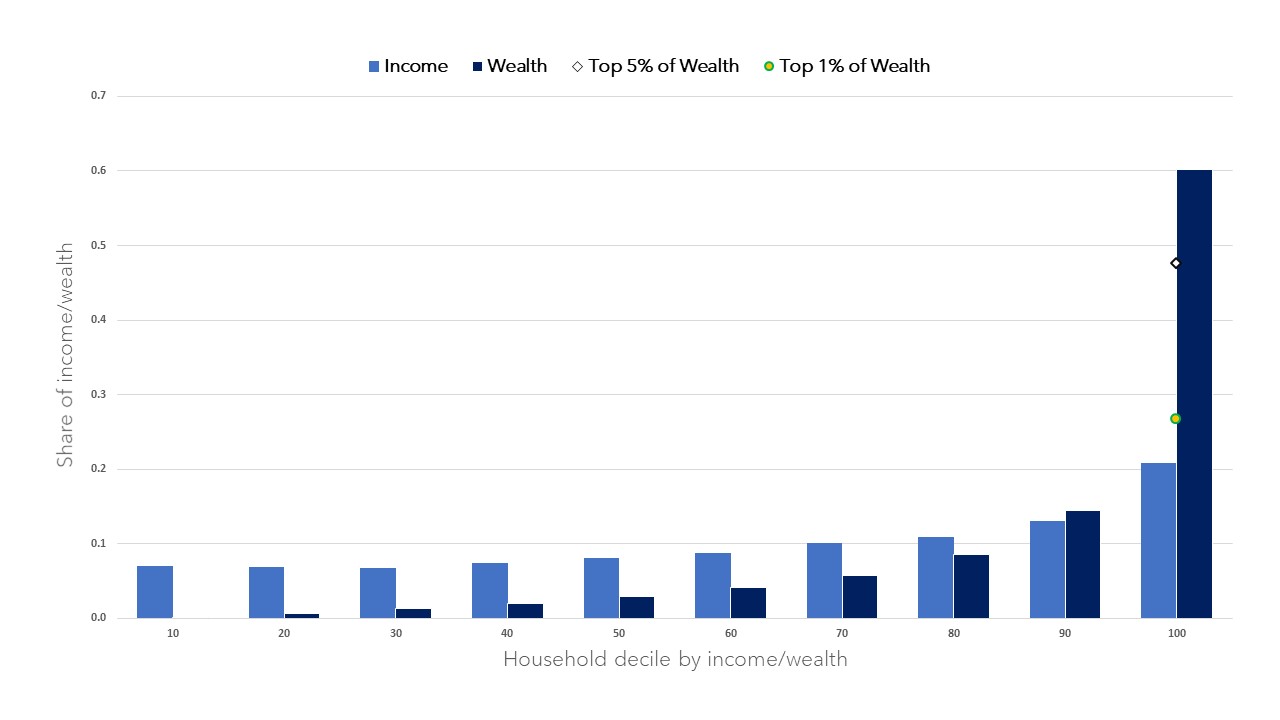
Alternatively, a comparison of the joint distributions of income and wealth reveals that low-wealth households are also low-income households, and vice versa (Burki et al., 2020). Figure 3 corroborates the conclusion that wealth inequality is more pronounced than income inequality. The share of total household wealth of the top 10 percent is almost three times the share of the total income of the top 10 percent. Moreover, each income decile holds at least 5 percent of income share (see, income bars). In contrast, 83 percent and 96 percent of the nation’s wealth is held, respectively by top 20 percent and 40 percent of the households.
Source: Authors’ calculations based on PSLM-HIES 2013-14
| 2005-06 | 2013-14 | |
|---|---|---|
| A: Proportion of top 1% of households by income in private wealth groups | ||
| Top 1% of private wealth | 45% | 38% |
| Top 5% | 75% | 77% |
| Top10% | 81% | 82% |
| Top20% | 90% | 87% |
| B: Proportion of top 1% of households by private wealth in income groups | ||
| Top 1% of income | 45% | 38% |
| Top 5% | 81% | 67% |
| Top 10% | 90% | 81% |
| Top 20% | 96% | 91% |
Table 1 also shows that the degree of correlation between income and wealth has somewhat declined since 2005-06 for the top 1% of households. This may be attributed to the post-2007 crisis in real estate and stock markets, which seems to have eroded income and wealth amongst upper income groups (who tend to invest most of their savings in these markets). The decline in correlation is worth investigating further for policy implications of managed wealth redistribution effects.
Is household wealth concentrated in few hands?
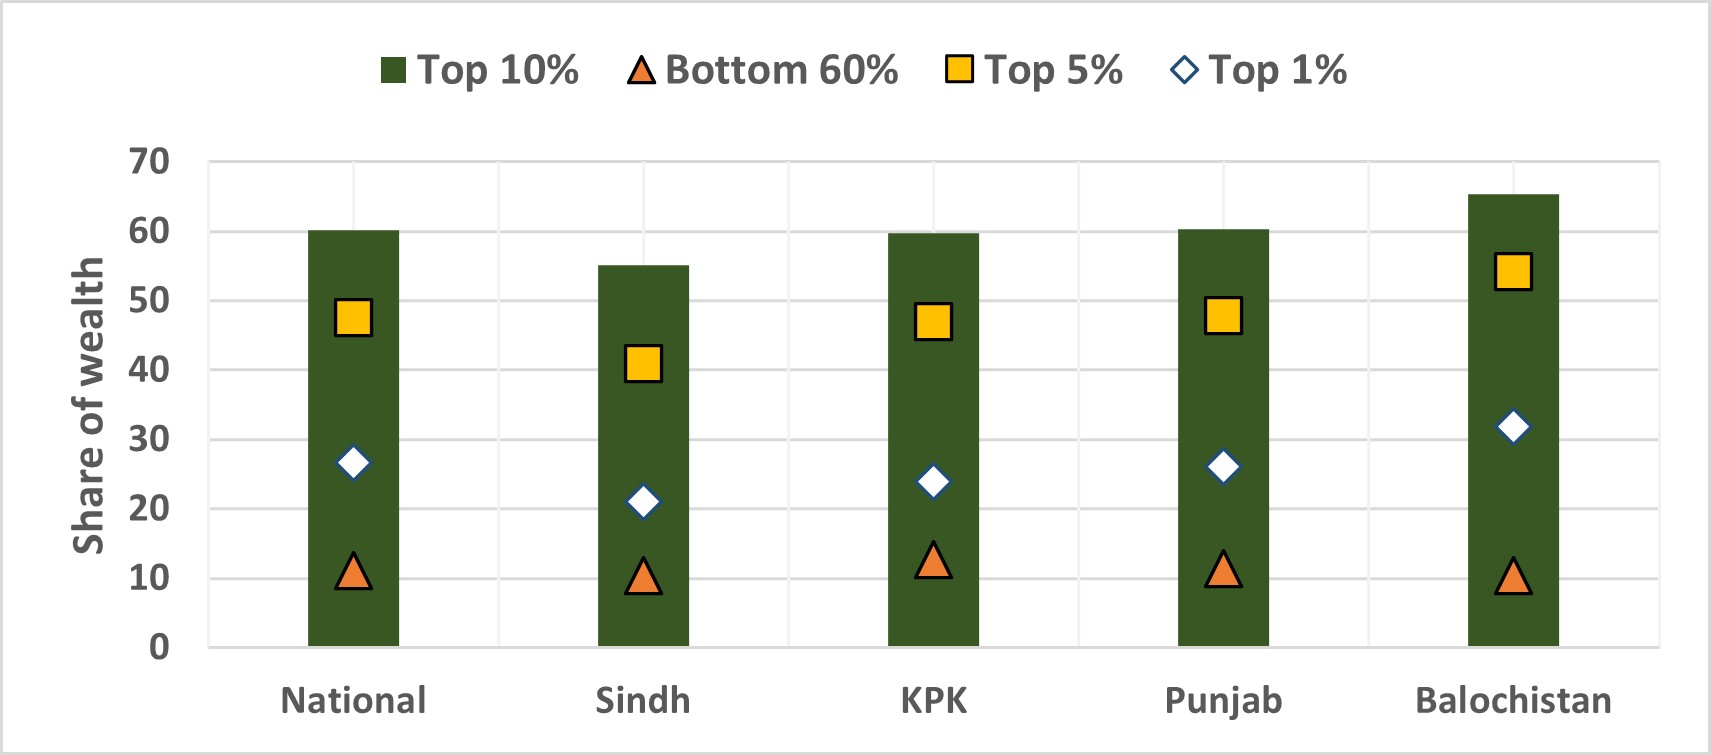
There is clear evidence to show that household wealth is concentrated in few hands. Whereas the bottom 60 percent Pakistani households own just one-tenth of the national wealth, the top 10 percent of households own 60 percent of total wealth (Figure 4). This exceeds wealth concentration in 17 OECD countries, where the top 10 percent of households own 50 percent of total household wealth (Durand and Murtin, 2015).
Among the four provinces, the distribution of household wealth is most unequal in Balochistan, where the wealthiest 10 percent, 5 percent and 1 percent households own 65 percent, 54 percent and 32 percent of all wealth respectively, while the bottom 60 percent of households own less than 10 percent of all wealth. Based on these measures, wealth is most equally distributed in Sindh, while the wealth shares owned by the households in Punjab and KPK closely mimic the national figures.
Source: Authors (based on PSLM-HIES 2013/14)
How do income and wealth inequalities impact absolute poverty?
Simulation analysis suggests that a more equitable distribution of wealth is far more powerful a redistributive tool to alleviate poverty than a more equitable distribution of income. Since many people live near the poverty line, an income/wealth transfer moves a large number of them across the poverty line. Since wealth transfers are relatively larger, they are more effective in moving people across the poverty benchmarks.
We find that a 54 percent reduction in income inequality (from its baseline value of 32.7 percent in 2013/14 to a hypothetical value of 15 percent) decreases the number of poor from 47.3 million to 21 million, or nearly 57 percent reduction in absolute poverty (Burki et al., 2020). On the contrary, only a 0.14 percent reduction in wealth inequality (falling from its baseline value of 70.7 percent to 70.6 percent) leads the national poverty level to drop to zero.
In sum, the stark inequalities of income and wealth have far-reaching implications for Pakistan’s economy and society, highlighting that a government policy prioritizing poverty alleviation alone may not be enough to mitigate real drivers of rising poverty levels.
Abid A. Burki is an MHRC Fellow and former Professor of Economics at LUMS.
Arsalan Hussain is a Teaching Fellow in Department of Economics at LUMS.
Kinza Emad Khan is a Teaching Fellow in Department of Economics at LUMS.
Mahbub ul Haq Research Centre at LUMS
Postal Address
LUMS
Sector U, DHA
Lahore Cantt, 54792, Pakistan
Office Hours
Mon. to Fri., 8:30 a.m. to 5:00 p.m.

